Here at AV we've been working with some new soil-sampling equipment: our power probe and electromagnetic soil electrical conductivity sensor. We've taken data collected via these tools and integrated it with old-fashioned soil pit analysis. The result is a way to spatially view numerous aspects of soils. Check it out!
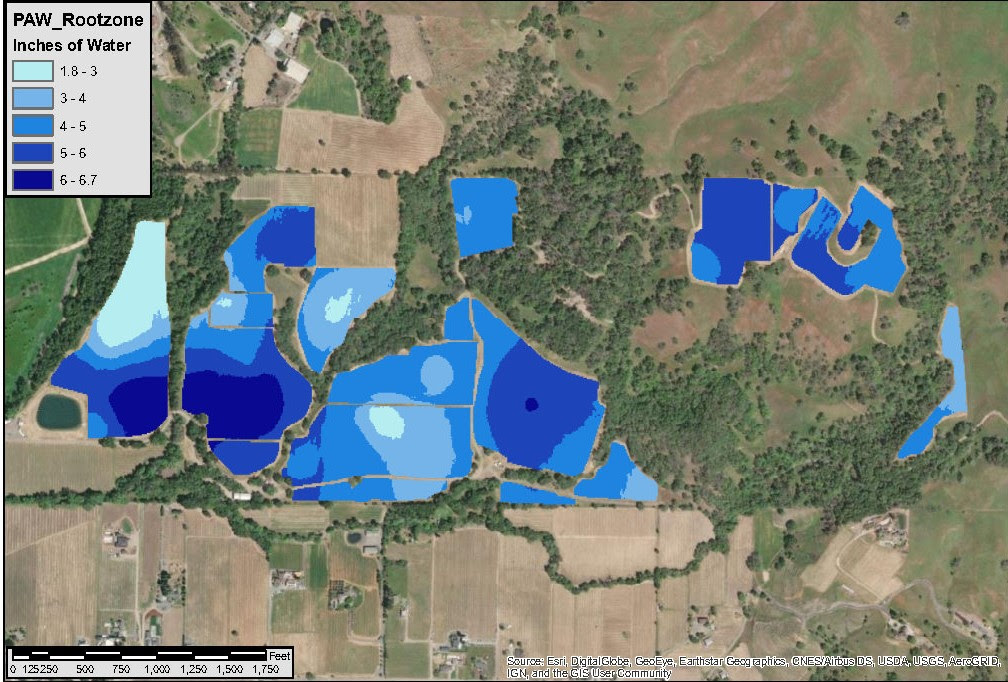 We can use this information to look varying levels of plant-available water in the rootzone.
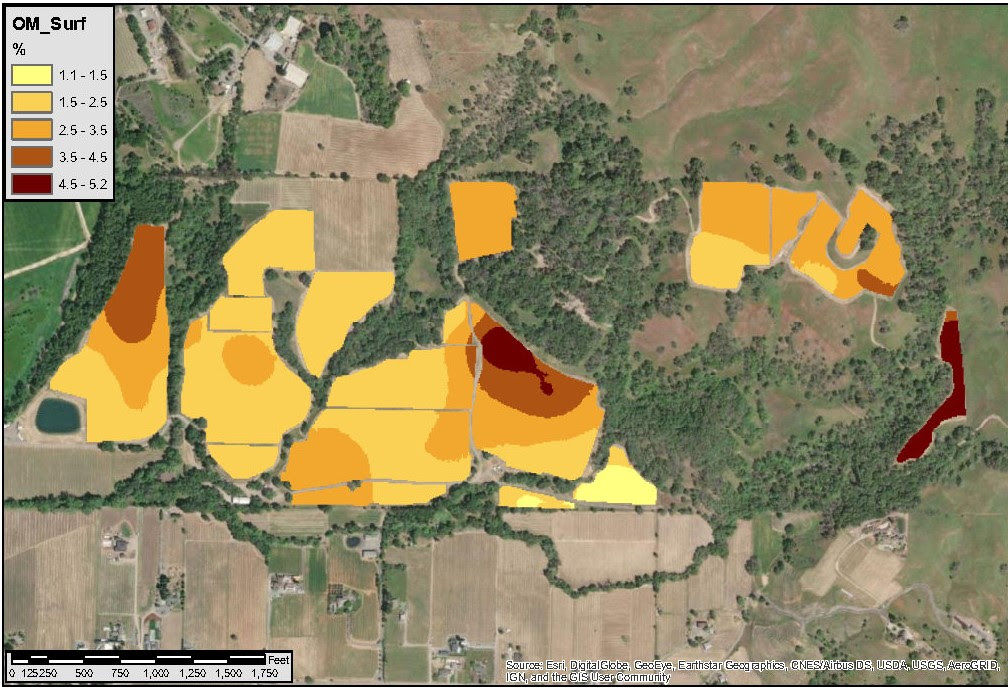 We can also look at differences in organic matter percentage.
These are just a few examples of the numerous soil characteristics we can analyze and present. These maps consolidate tables of numerical data into spatial maps that are easily interpreted by anyone - not only soil experts!
Read this recent response from one of our clients:
"The amount of information is incredible. Very informative for a guy like me who doesn’t know much about the roles of different soil levels. The color map charts clearly show some mass differences throughout the property. It appears to be a very powerful tool for (our vineyard manager) to better understand your recommendations for treatments to certain sections/blocks."
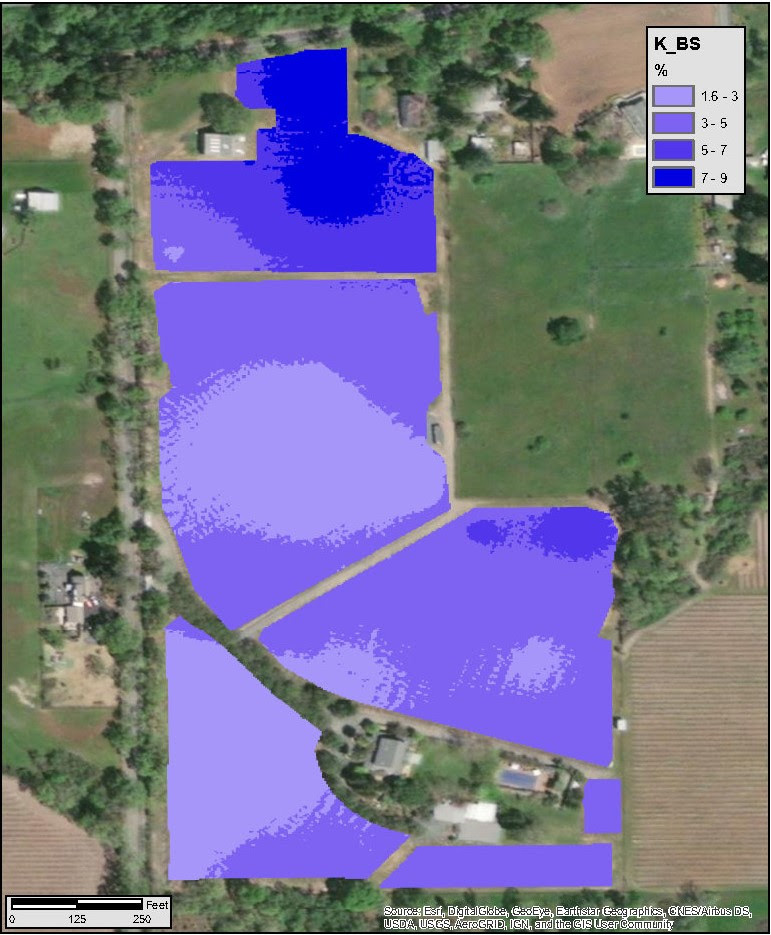 This map shows the K-base saturation
Want to make more informed decisions on fertilizer-applications and irrigation?
Contact loni@advancedvit.com to discuss your next soil project.


Loading comments...